RTD and No-Alc Series, Part 1
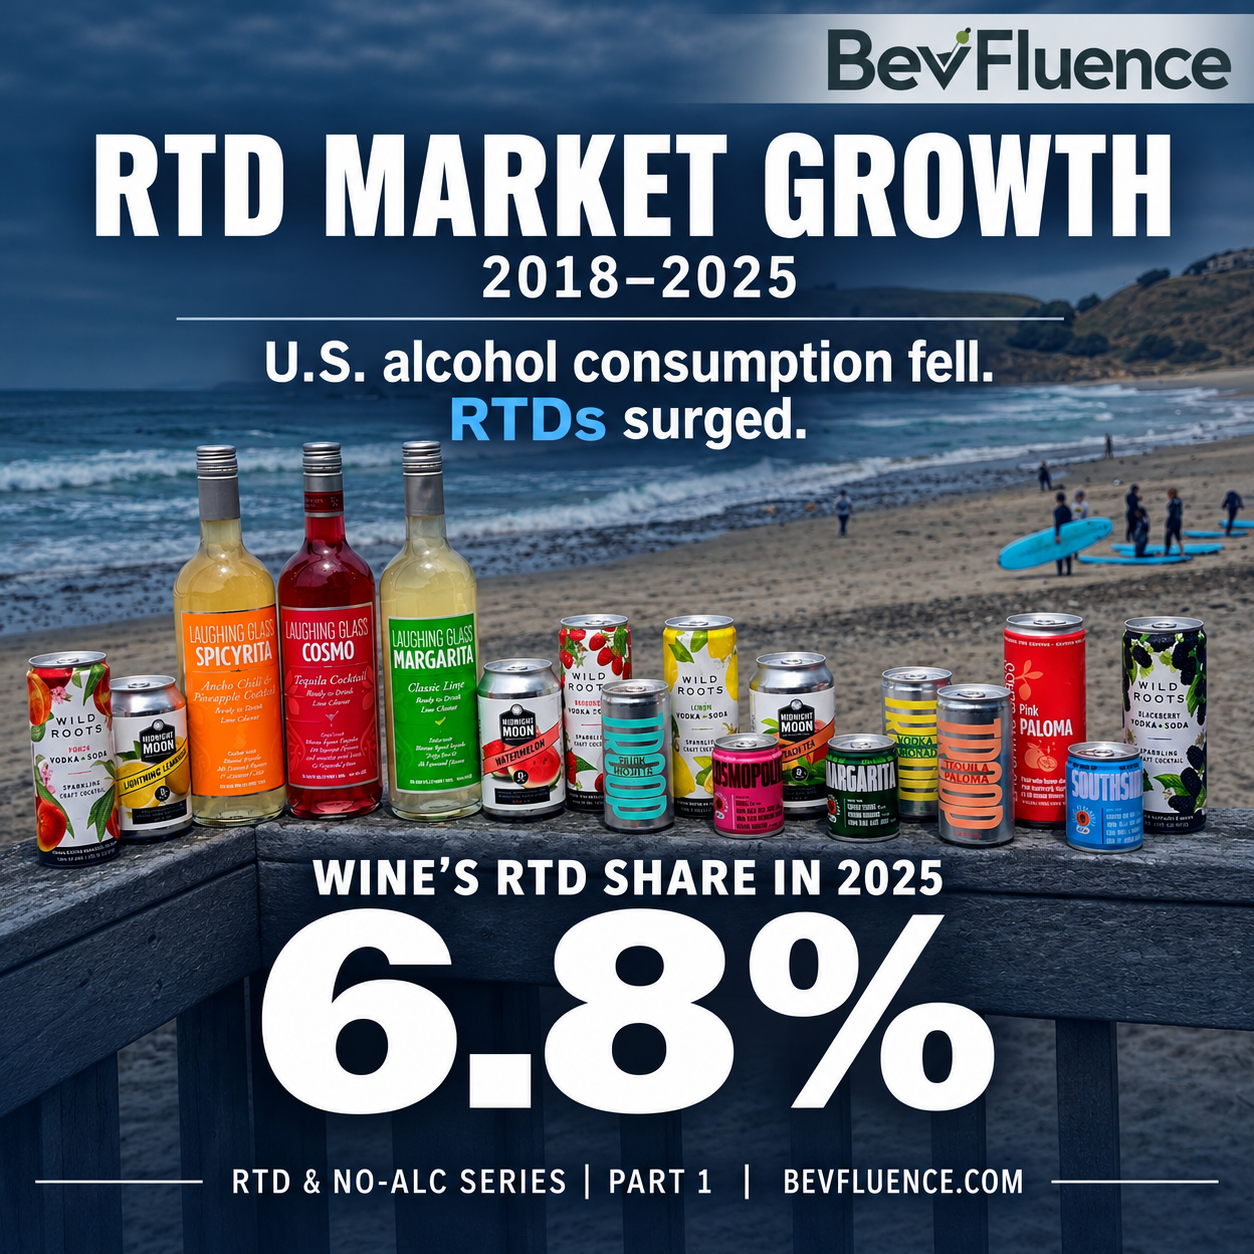
Ready-to-drink beverages grew while American drinking shrank, and the category’s center of gravity has moved from seltzer to spirits. Linkfluence’s 2020 social intelligence report, citing IWSR, notes U.S. alcohol consumption fell for a third straight year. In that same stretch, the RTD category exploded. By 2025, wine held just 6.8% of its category dollars in RTD form, per Danny Brager’s January 2026 Unified Symposium presentation. Spirits and beer both did better.
That’s the story in three sentences. A format took share from a shrinking pie. Spirits brands bought, built, and premiumized their way into the lead. Wine is still deciding whether to show up.
This article tracks the run year by year, from the 2018 seltzer spike to the 2025 shelf. Every number below comes from a named source. Where sources disagree, we say so out loud.
The Numbers That Started the Run: 2018 to 2019
RTDs aren’t new. Linkfluence reports the category enjoyed success in the 1990s and early 2000s, when products were often highly sweetened. The comeback version is different: lower in carbs and lower in alcohol.
The sales data shows how fast that comeback hit. Nielsen data, reported by CNN and cited by Linkfluence, tracked October 2018 to October 2019. Prepared cocktail sales rose 17%, canned wine jumped 73%, and hard and spiked seltzers grew 200%.
Seltzer was the clear breakout. Canned wine posted a big number on a small base. Prepared cocktails grew steadily, and that steady growth set up everything that came after.
The Conversation Grew Faster Than the Sales
Linkfluence measured U.S. English-language social posts from July 1, 2018, to December 31, 2019. Its scope covered 399,000 posts across Twitter, Facebook, Instagram, forums, blogs, reviews, and media sites. Post volume grew 650% between 2018 and 2019.
The split was lopsided. Hard and spiked seltzers drew 82% of RTD posts. Canned wine and champagne drew 10%, and canned cocktails drew 8%.
Engagement climbed even faster than volume. Interactions per RTD post rose 333%, from 10.2 in 2018 to 44.2 in 2019. On Instagram, RTD posts averaged 134.2 interactions each, per Linkfluence.
Desirable, and Divisive
Linkfluence scored RTDs at 2.8 positive posts for every negative one. That’s a strong desirability ratio for any trend. But the report also calls the category polarized, with heavy advocates and heavy detractors.
The complaints were specific. Some drinkers said hard seltzer tasted like watered-down candy or sparkling water with a chemical edge. Others called the hype confusing after one taste.
That split matters for brands today. A category built on fast trial also builds fast rejection. The brands that lasted gave drinkers a reason to come back after the novelty wore off.
The Can Became the Marketing
Linkfluence credits packaging with part of the boom. Compared with older RTDs like alcopops, new brands fully exploited the can format. Sleek, eye-catching designs turned cans into fashion accessories on social media.
The report pairs that with a values shift. Linkfluence lists togetherness, fun, pop and internet culture, creativity, versatility, and commitment as the values tied to RTDs. Togetherness and fun did the most to drive the trend.
Sustainability showed up too. Linkfluence found it made up just over half of commitment-related posts. Drinkers praised cans for easy recycling and called out brands that added plastic straws.
White Claw Was the Category in 2019
You can’t read 2019 RTD data without reading White Claw data. Linkfluence, citing Eater and CNN, reports White Claw held 60% of the hard seltzer category. The brand generated around $1.5 billion in sales in 2019.
The social numbers were even more concentrated. White Claw drew more than 80% of branded RTD conversation and 254,000 posts. Truly followed with 16,100 posts, then Bon & Viv with 8,000, Smirnoff with 3,500, Natural Light with 2,900, and Buzz Ballz with 2,700.
White Claw’s desirability ratio was 1.8 positive posts per negative one. That’s lower than the 2.8 RTD average. The biggest brand was also the biggest target.
The Parody, the Shortage, and the Hands-Off Playbook
Comedian Trevor Wallace released a parody video in July 2019. Linkfluence reports user-generated content about White Claw jumped 315% that month versus the month before. Consumers drove 79% of White Claw conversation, compared with 30% for Bon & Viv and 34% for Truly.
Word of mouth led to a shortage in September 2019. Linkfluence notes the shortage created a sense of exclusivity, which pushed demand even higher. One post captured in the report described a concert concessions executive “completely blindsided by the demand for White Claw.”
The brand’s own posting was minimal. After the parody, White Claw posted about 0.5 times a week on Instagram and 1.4 times a week on Twitter. It joined the conversation instead of trying to run it.
The Challengers Grew Too
White Claw’s lead didn’t freeze the field. Linkfluence tracked monthly posts against the prior year. Truly rose 331%, and Bon & Viv rose 1,149%.
Linkfluence’s warning was blunt. White Claw’s universal positioning lacked niche popularity, which created risk for sustained advocacy. More brands would chase specific digital tribes.
That prediction set the stage for 2021. The challengers didn’t beat White Claw at seltzer. They changed what drinkers wanted next.
2020: The Pandemic Moved the Format Home
The pandemic didn’t create RTD demand. It removed the bar as the default place to drink a cocktail. RTDs filled that gap.
The broader market took a hit first. Zenith, citing Euromonitor, reports alcohol sales across 12 key markets fell from $761 billion in 2019 to $659 billion in 2020. That 13.4% drop was three times faster than the fall in overall consumer spending.
FlavorSum’s 2021 formulation e-book cites IWSR data showing global RTD consumption rose more than 40% in 2020. FlavorSum also reports U.S. hard seltzer gained 130% in 2020 as the leading RTD sub-segment. That growth drove RTD volume above total spirits.
The short-window data was sharper still. Grand View Research, citing a July 2020 VinePair article, reports U.S. RTD cocktail sales rose 91.8% between May 31 and June 27, 2020. Zenith, citing Nielsen CGA, reports a 131% rise for pre-mixed cocktails and RTDs in the U.S.
Launch Volume Doubled
New products poured in to meet demand. FlavorSum reports North American RTD cocktail launches more than doubled in 2020. Almost 60% of those new entries were labeled seltzers.
Wine-based entries grew too. Spritzers, coolers, and wine seltzers more than doubled in 2020, per FlavorSum. Vodka was the most popular spirit base for RTD cocktails.
FlavorSum projected gains of more than 25% in 2021. It also cited a 10.2% compound annual growth rate through 2025 across the United States, Japan, Australia, Canada, and China. Those were forecasts, not results, and we report them as forecasts.
The E-Commerce Signal
Drizly’s 2020 Consumer Survey Report gave an early read from the delivery side. Hard seltzer reached 3.67% of total Drizly platform sales as of June 1, 2020. That compared with 3.08% at the beginning of June 2019.
Drizly also saw cocktail ingredients surge. From the week of March 23 through the week of May 25, mixers, syrups, and bitters ran 1,107% over baseline. Liqueurs, cordials, and schnapps ran 814% over baseline.
Those numbers point two ways at once. Drinkers bought premixed convenience. They also learned to mix at home, and that habit raised their expectations for what a canned cocktail should taste like.
The Channel Shift Behind the Growth
RTD growth rode a channel change, not just a taste change. Zenith reports Drizly’s sales rose 350% in 2020. Zenith also cites an IWSR survey finding 44% of Americans who shop online for alcohol started doing so in 2020.
Cascadia Capital cites an IWSR forecast for U.S. online alcohol sales. It projected growth from $3 billion in 2019 to $13.4 billion by 2024. Cascadia notes wine drove that early online growth, because it faces fewer state-level shipping limits.
Drizly’s own survey shows how fast the habit formed. Among current Drizly users, 72% expected at least half their alcohol shopping to happen online in the next year. That was June 2020, before most bars reopened.
Ad Dollars Followed the Drinker
Zenith tracked alcohol advertising across 12 markets that hold 73% of global adspend. Alcohol adspend fell from $7.6 billion in 2019 to $6.7 billion in 2020. Zenith forecast a recovery to $7.7 billion by 2023.
The mix shifted under that total. Digital took 21% of alcohol ad budgets in 2019 and 24% in 2020. Zenith forecast 30% by 2023, with alcohol TV spending falling 2.4% a year.
Zenith explains why. Alcohol brands historically spent twice as much on TV as the average brand and nearly four times as much on out-of-home. The young drinkers most likely to try a new drink had already moved to digital.
The rebound started fast. Zenith forecast alcohol adspend would grow 5.3% in 2021, ahead of 4.9% for the overall ad market. That followed an 11.6% drop in alcohol advertising in 2020.
Grocery Became the Default Shelf
Grand View calls grocery stores a key RTD channel, naming national chains like Kroger. It reports supermarkets give RTD cocktails designated shelf space because of their low alcohol levels. It also calls online distribution a growth driver.
Thach’s 2025 shopper data confirms grocery’s reach for wine-based drinks. Supermarkets and grocery stores ranked first among store types for buying wine or wine-based drinks. Large wine and liquor chains ranked second.
That’s the shelf RTDs fight on. The can sits next to the bottle, and the drinker compares them in the same trip. Brager’s 2026 presentation flags affordability and price per serving as live factors in that comparison.
Sizing the Cocktail Segment, and a Labeling Problem
Market sizing is where RTD content usually goes wrong. Reports measure different things, then writers quote them side by side. We’ll use one primary source and flag the rest.
Grand View Research’s sample report sizes the global RTD cocktail market at $714.8 million in 2020. It forecasts a 12.0% compound annual growth rate from 2021 to 2028. FlavorSum cites a separate Grand View release forecasting global RTD cocktail sales of $1.63 billion by 2027.
Grand View’s scope matters here. It covers wine-based, spirit-based, and malt-based RTD cocktails. It isn’t a measure of every canned alcoholic drink, and it doesn’t include the full hard seltzer business.
Cascadia’s Chart Says “U.S.”
Cascadia Capital’s Fall 2021 market update charts a “U.S. RTD Cocktail Market.” The chart runs from $715 million in 2020 to a projected $1.775 billion in 2028. Its listed source is Grand View Research.
Grand View’s own sample labels the $714.8 million figure as global. Cascadia labels nearly the same number as American. Both can’t be right.
We follow the primary source. Grand View measured the global market, so we report it as global. Any brand deck quoting $715 million as a U.S. number is quoting a labeling error.
Where the Cocktail Dollars Sat
Grand View broke the 2019 market down by type and package. Spirit-based RTD cocktails held the largest revenue share, at 43.6%. Grand View expected that segment to keep its lead and post the fastest growth.
Wine-based RTD cocktails held the second-largest share in 2019. Grand View attributes that to consumers seeing wine as healthier than spirits and malt. It calls malt-based cocktails sweeter, without a well-defined taste.
Bottles held 58.5% of 2019 revenue, per Grand View. Cans were set to grow fastest, because they’re lighter, easier to recycle, and allowed in places where glass isn’t. Grand View cites aluminum shortages in the U.S. as one reason some RTDs launched in glass.
What Grand View Says Drove Demand
Grand View lists the drivers in plain terms. Health concerns pushed demand for flavored drinks with lower alcohol content. Its report puts typical RTD cocktail strength at 4% to 7% ABV.
Busy schedules mattered too. Grand View cites growing interest in ready-to-eat and ready-to-drink products among working consumers. It also notes some moderate drinkers use RTD cocktails as a substitute for wine and other spirits.
Grand View also lists a restraint, and it’s worth reading twice. Non-alcoholic RTD consumption is rising in France, the U.K., Germany, Spain, and Canada. Some drinkers are leaving alcohol for fortified water and functional drinks, which Part 4 covers in depth.
2021: Seltzered Out and Buying Up
By 2021, the seltzer story had a second chapter. Cascadia Capital reports younger drinkers had gotten “seltzered-out.” They still wanted products that were light, easy-drinking, and flavorful.
Cascadia names the beneficiaries. Hard teas, hard kombucha, and non-carbonated RTDs grew fast. Non-carbonated products appealed in part because many drinkers dislike the bloated feeling from carbonation.
The shift also showed up in consumer intent. Drizly’s June 2020 survey found 38% of respondents planned to drink hard seltzer that year, down from 52% who drank it the year before. Another 31% said they would consider it.
The Spirits Majors Moved In
Cascadia calls premiumization the driver of RTD demand in 2021. Drinkers wanted trusted, classic recipes from established brands. In Cascadia’s words, the belief that canned cocktails are lower quality “has completely shifted away.”
The deal list backs that up. Cascadia’s transaction tables and narrative include these 2021 moves:
- Diageo acquired Far West Spirits, maker of Lone River Ranch Water, in March 2021. Lone River was then sold in Alabama, Arizona, Florida, Tennessee, and Texas.
- Diageo closed a deal for Loyal 9 Cocktails in April 2021.
- Anheuser-Busch InBev entered a partnership with Canteen Spirits in spring 2021. Canteen had sold more than 517,000 cases over the trailing 12 months.
- E&J Gallo closed a deal for LIQS in May 2021.
- Sleeman and Sapporo acquired SoCIAL LITE, which Cascadia credits with launching the first unsweetened pre-mixed vodka soda.
The Moves Started Earlier
Grand View logs two earlier signals. In August 2020, Diageo launched Gordon’s Pink Martini and Smirnoff Passion Fruit Martini in aluminum cans. In September 2020, Beam Suntory acquired On The Rocks Premium Cocktails.
Coffee joined the format too. Cascadia reports La Colombe and MillerCoors created a hard cold brew at 4.2% ABV. Newground Hard Dutch Lattes launched an RTD hard latte at 5% ABV.
The pattern is clear. Brewers built seltzer first. Spirits companies then bought the brands that made cocktails credible in a can.
Cascadia counted beverage deals over the four quarters ending October 2021. Non-alcoholic beverages led with 23 transactions, followed by wine with 16, spirits with 15, and beer with five. Cascadia notes alcohol deal activity aligned toward hard seltzer-adjacent products.
Beer Brought Big Names Too
The beer side didn’t sit still. Drizly flagged Bud Light Seltzer and Corona Seltzer as 2020’s highest-profile introductions. Drizly said they could take double-digit share while expanding the category.
Drizly also found hard seltzer drinkers rarely planned to cut other drinks. When they did trade, they traded from cider, hard lemonade, and wine. Wine was already on the trade-out list.
That detail matters for wine brands reading this in 2026. The trade-off started six years ago. It didn’t start with Gen Z.
Why Spirits Are Winning the Format
Zenith’s alcohol business intelligence report explains the spirits advantage in one line. Spirits brands didn’t outsell beer by selling more products. They persuaded drinkers to trade up to higher-value products with better experiences.
Zenith, citing Euromonitor, reports spirits sales ran 4% ahead of beer sales in 2017. By 2019, that lead had tripled to 12%. Zenith forecast spirits sales would exceed beer sales by 23% in 2023.
The pandemic tested that model. Zenith reports spirits volumes and sales both fell 11% in 2020, so premiumization paused rather than reversed. Spirits brands replaced the bar experience with an at-home one, including recipes and cocktail-making content.
The 2025 Scoreboard
BevFluence’s brand strategy guide sums up the current spirits picture. Traditional spirits declined 8% as the market worked through excess stock. Ready-to-drink cocktails have been a major growth driver in the spirits category.
Brager’s January 2026 presentation shows the scale. His slide is titled “Just A Few Of The Really Big RTD Drink Disruptors.” It lists figures of $2.3 billion, $1.4 billion, $818 million, $764 million, and $396 million. It also shows one RTD at roughly 24 million cases in 2025, labeled the top spirits brand by volume.
The same slide lists the biggest wine brands for comparison. Barefoot sits at $888 million and Josh at $866 million. Sutter Home sits at $536 million, and La Marca sits at $489 million.
What That Comparison Means
Brager’s data covers off-premise measured channels for the 52 weeks ending December 27, 2025. The two largest RTD figures on his slide are bigger than any wine brand listed. The brand names behind the RTD numbers aren’t in the slide text we have, so we don’t name them.
The point stands without names. The top RTD figure on the slide is more than double Barefoot’s $888 million. That’s not a niche format anymore.
Brager frames RTDs in four words: flavors, format, function, and financial, meaning price per unit. Each one is a place where a can beats a 750 ml bottle for a specific occasion. None of them is about tradition.
2025: Wine Is Losing the Format War
Brager’s “Wine RTD Share Trails Beer/Spirits RTD Share” slide is the headline for wine. In total U.S. off-premise measured channels, RTDs made up 6.8% of wine’s category dollars. Spirits and beer/malt both posted higher RTD shares, on both dollars and volume.
The shelf is tightening at the same time. Brager reports wine points of distribution fell versus the prior year in both off-premise and on-premise channels. That drop hit in both 2024 and 2025.
Retailers are asking a hard question, in Brager’s words. How many items of a given segment do they really need to satisfy demand? Wine’s answer keeps getting smaller.
The Younger Drinker Gap
Dr. Liz Thach, MW, president of the Wine Market Council, presented the generational picture at the same symposium. All generations report drinking traditional wine at nearly equal rates. But wine cocktails, RTDs, and non-alcoholic wine are consumed much more often by Gen Z and Millennials.
Thach’s 2026 recommendations make the format point directly. Her second recommendation is to show wine in fun occasions through wine cocktails and RTDs. She suggests pouring wine at music festivals and food fairs, and adding a wine cocktail to the tasting room.
Brager lands in the same place. He lists wine RTDs, including cocktails and spritzers, as an opportunity to test, learn, and compete. He sees upside in both off-premise and on-premise channels.
Format Follows Occasion
Brager’s first rule for 2026 is “Format follows Occasion.” Linkfluence’s 2020 data showed the occasions years ago. RTDs showed up at the beach, the pool, tailgates, picnics, hikes, house parties, and pre-games.
Linkfluence also found RTDs were far less visible at bars, clubs, and restaurants. Some drinkers said they preferred a freshly mixed cocktail on-premise. That’s the gap between wine RTDs and spirits RTDs are now fighting to close.
BevFluence’s brand guide notes wine-based RTDs and sparkling wine in new packaging are showing strong performance. The brands winning there didn’t wait for the category to settle. They built for the occasion first.
The Objection Wine Still Raises
The real objection isn’t “RTDs are a fad.” The data killed that argument in 2019. The real objection is quality: a canned drink can’t match a glass poured by a pro.
Linkfluence’s data answers part of that. Over half of consumers commenting on canned wine and canned cocktail taste said they enjoyed the products. Many wine drinkers said they started skeptical and ended up surprised.
The complaints were real, though. Drinkers called out metallic notes from the can, drinks that were too sweet, and products that didn’t feel high-quality. Those are formulation problems, and formulation is the subject of Part 2.
Regulation Is the Other Drag
FlavorSum flags a regulatory mismatch that still shapes the shelf. As of 2021, the Alcohol and Tobacco Tax and Trade Bureau had approved three new spirits container sizes: 700, 720, and 900 ml. In the same ruling, it didn’t accept 200, 250, and 355 ml containers.
Those smaller sizes are the most popular formats for canned wine, per FlavorSum. That inconsistency makes it harder for distillers and brewers to compete in cans. FlavorSum’s take is that the category’s complexity could restructure the alcohol market.
Tax adds another layer. FlavorSum notes sugar- and malt-based RTDs generally follow beer tax rules and can sell in grocery stores in most states. Spirit- and wine-based RTDs usually face higher tax rates and narrower distribution.
What the Data Says to Do in 2026
The RTD record from 2018 to 2025 points to a short list of moves. None of them guarantees a result. All of them follow the evidence above.
- Pick the base on purpose. Spirit-based cocktails led Grand View’s revenue split, while sugar and malt bases won on tax and grocery access.
- Build for an occasion, not a demographic. Linkfluence’s top tip was to create lifestyle-centered occasions instead of demographic ones.
- Let drinkers carry the story. White Claw posted rarely and let user content lead, while consumers drove 79% of its conversation.
- Plan for fatigue. Cascadia’s “seltzered-out” finding shows how fast a hit sub-segment cools.
- Fix the can before you scale it. Metallic notes and excess sweetness were the top taste complaints.
What Wine Should Stop Saying
Wine brands keep treating RTDs as a threat to the bottle. Brager’s numbers say the bottle is already losing shelf space without them. The format question isn’t whether to compete, but where.
Thach’s data shows younger drinkers still like wine. They drink it alongside cocktails, RTDs, and non-alcoholic options. A wine brand without a format for those occasions isn’t protecting its image. It’s opting out of the visit.
Part 2 goes inside the can. It covers bases, carbonation, and flavor data. It also covers the label rules that decide what reaches the shelf.
Next in the series: Part 2, Flavored RTD Cocktails: Bases, Carbonation, Flavor Data, and Label Rules.
References
Brager, D. (2026, January 28). Consumer demand: At the crossroads [Conference presentation]. Unified General Session, Sacramento, CA, United States.
BevFluence. (n.d.). BevFluence complete brand strategy guide [Internal strategy document].
Cascadia Capital. (2021). Beverage industry market update: Fall 2021 [Market report].
Drizly. (2020). Drizly consumer survey report 2020: Alcohol shopping and attitudes, mid-2020 [Survey report].
FlavorSum. (2021). How to master formulation challenges in the “Wild West” of RTD cocktails: Guidelines for brewers and distillers [E-book].
Grand View Research. (n.d.). Ready to drink cocktails market analysis and segment forecasts to 2028 [Sample report].
Linkfluence. (2020). Hard seltzers, canned wine and canned cocktails: What’s driving the ready-to-drink beverage boom? [Social intelligence report].
Thach, L. (2026, January). The pulse of the U.S. wine consumer: Opportunities in 2026 and beyond [Conference presentation]. Wine Market Council, Unified Symposium, Sacramento, CA, United States.
Zenith. (n.d.). Business intelligence – Alcohol: Beer + spirits [Industry report].